Unlocking the Power of Statistical Analysis: What Do You Mean by Correlation and Regression?
Statistical analysis plays a crucial role in various fields, including finance, marketing, and scientific research. Two commonly used statistical techniques are correlation and regression. In this article, we will explore the meaning and significance of correlation and regression, and how they can unlock the power of statistical analysis.
Understanding Correlation
Correlation refers to the statistical relationship between two or more variables. It helps us understand how changes in one variable relate to changes in another. Correlation is measured using a correlation coefficient, which ranges from -1 to +1. A positive correlation coefficient indicates a direct relationship, where both variables increase or decrease together. On the other hand, a negative correlation coefficient suggests an inverse relationship, where one variable increases while the other decreases.
Correlation is valuable in identifying patterns and trends in data. For example, in marketing, it can help determine if there is a relationship between advertising expenditure and sales revenue. By analyzing the correlation coefficient, we can assess the strength and direction of the relationship, allowing businesses to make informed decisions and optimize their strategies.
Exploring Regression
Regression analysis, on the other hand, goes beyond correlation by establishing a predictive model. It helps us understand how an independent variable influences a dependent variable. In simple terms, regression allows us to predict the value of one variable based on the value of another.
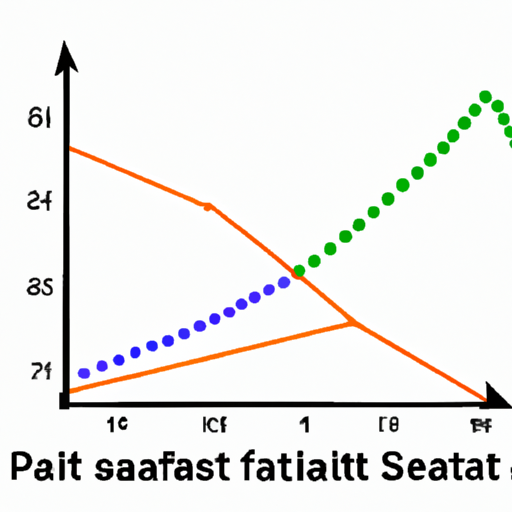
There are different types of regression analysis, such as linear regression, multiple regression, and logistic regression. Linear regression is the most commonly used technique, where a straight line is fitted to the data points to establish the relationship between the variables. This line represents the best-fit equation that can be used for prediction.
Regression analysis is widely used in various fields. For instance, in finance, it can help predict stock prices based on historical data and market trends. In healthcare, regression analysis can be used to predict patient outcomes based on factors such as age, gender, and medical history. By understanding the relationship between variables, regression analysis enables us to make accurate predictions and informed decisions.
The Power of Statistical Analysis
Correlation and regression are powerful tools in statistical analysis. They allow us to uncover hidden relationships, make predictions, and gain insights into complex data sets. By understanding the meaning and significance of correlation and regression, we can harness the power of statistical analysis to drive decision-making and achieve desired outcomes.
In conclusion, correlation and regression are essential techniques in statistical analysis. Correlation helps us understand the relationship between variables, while regression allows us to predict values based on this relationship. By utilizing these tools effectively, businesses, researchers, and professionals can unlock the power of statistical analysis and make data-driven decisions.